7 minutes
AKS monitoring with Prometheus
Welcome to the first post on my Blog! Yay!!
A Huge thanks to the Lads behind the 2019’s Azure Advent Calendar: @Pixel_Robots and @gregor_suttie, alongside all the other 74 awesome people contributing to this community-driven Event!
A Video was made as well to walk you through everything discussed on this post, please ge check it out here
Today We will go through the Open Source options available for monitoring Azure Kubernetes Service (AKS) clusters.
We will have a closer look at the Open Source toolkit widely used by the Kubernetes Community: Prometheus, and how it can be used and deployed on the clusters
The following will be covered:
- Deploying and configuring the Prometheus stack using Helm Charts and the Prometheus Operator
Pre-requisites:
- Basic knowledge of Kubernetes commands and components
- A working AKS cluster
- You can use the scripts/create_aks.sh AZ CLI script from the repo aks-prometheus, link in the following section
- Helm deployed onto the Cluster - install Procedure
- AZ Cli installed - install Procedure
adeelku/aks-prometheus
- Repo for the Azure Advent Calander 2019 Video and blog post: Adeelku/aks-prometheus
- You will find here all the scripts and configuration files, used in this post, to build AKS cluster and configure Prometheus, Alertmanager and Grafana
- Azure Advent Calendar: Youtube Channel
Introduction to Prometheus
Prometheus is an open-source systems monitoring and alerting toolkit originally built at SoundCloud. Prometheus has been adopted since its inception, by many companies and organizations, and the project has a very active developer and user community. It is now a standalone open source project and maintained independently of any company. Prometheus joined the Cloud Native Computing Foundation in 2016 as the second hosted project, after Kubernetes.
Prometheus Components
- Prometheus Operator
In late 2016, CoreOS introduced the Operator pattern and released the Prometheus Operator as a working example of the pattern.
The Prometheus Operator is simple to install with a single command line, and enables the configuration and management of Prometheus instances using simple declarative configuration that will, in response, create, configure, and manage Prometheus monitoring instances.
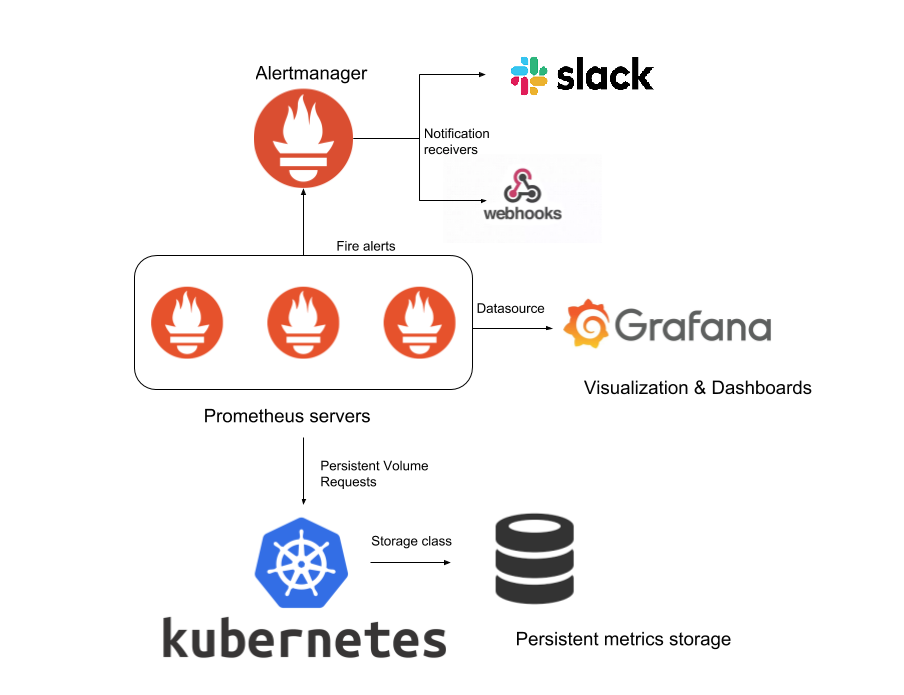
the Operator deploys the following components into the cluster:
- Prometheus
- Used to scrape the metrics from the endpoints discovered or customly configured
- Alert Rules are configured to send alerts to Alertmanager
- Alertmanager
- Used to agregate alerts and send them to customly configured receivers.
- These receivers can be: Webhooks for systems like Slack or xMatters, SMTP emailing system…
- Grafana
- Used to visualise the metrics collected by Prometheus and exposes them on prebuilt Dashboards.
Deloyment
Helm, the Package Manager for Kubernetes
Helm is a tool for managing Charts. Charts are packages of pre-configured Kubernetes resources.
We will deploy Prometheus using the stable helm chart for Prometheus Operator
The scripts needed to follow along can be found in my Github Repo (adeelku/aks-prometheus) mentionned in the beginning of this post.
clone the Github Repo using he follwing command
git clone https://github.com/Adeelku/aks-prometheus.git
- scripts/install_prometheus.sh
##!/usr/bin/env bash
set -e
echo "Creating namespace"
NS='monitoring'
if kubectl get ns | grep -iq $NS;
then
    echo "Namespace $NS already exists";
else
    echo "Creating namespace $NS"
    kubectl create namespace $NS;
fi
echo "Installing/Upgrading Prometheus"
helm upgrade --install prometheus \
--namespace monitoring \
stable/prometheus-operator \
--values ../helm/prometheus_values.yaml \
--values ../helm/alertmanager_values.yaml
Deploys Prometheus Operator and all the componants onto the Cluster - make sure you are using the correct Kubernetes context :)
kubectl config use-context <YOUR_CONTEXT>
Them run the script
cd scripts
./install_prometheus.sh
The script performs the following:
- Creates the namespace “monitoring” if it does not exist
- installs Prometheus and all its components within the monitoring namespace
- If a Helm release named prometheus exists already in the monitoring namespase, Helm will upgrade it
- Please note the use of *_values.yaml files after the –values parameter
- These values files help overide the Helm Chart templates with values specific to the configuration
AKS specific configuration
AKS being a managed Cloud service, Access to some of the components of the Cluster is not possible (Mutulized Kubernetes Control Plane), mainly the follwoing components running on the Master nodes:
- kube Controller Manager
- kube Scheduler
- kube Etcd
- kube Proxy
in addition to this, Kubelet, which is running on the Worker nodes is exposing its metrics on http, wheras Prometheus is configured to scrape its metrics on https
if we attempt installing Prometheus using the default values of the chart, there will be some alerts firing because endpoints will seem to be down and Master Nodes componants will show an error
Let’s try running the script without specifying any values.yaml file, thus deploying vanilla Helm Chart of the Prometheus Operator.
The command can be executed commenting the following lines
helm upgrade --install prometheus \
--namespace monitoring \
stable/prometheus-operator # \
# --values ../helm/prometheus_values.yaml \
# --values ../helm/alertmanager_values.yaml
Prometheus deploys the whole shebang with one line of code:
- Deployments
- Services
- Statefulsets
- Replicasets
- and Pods
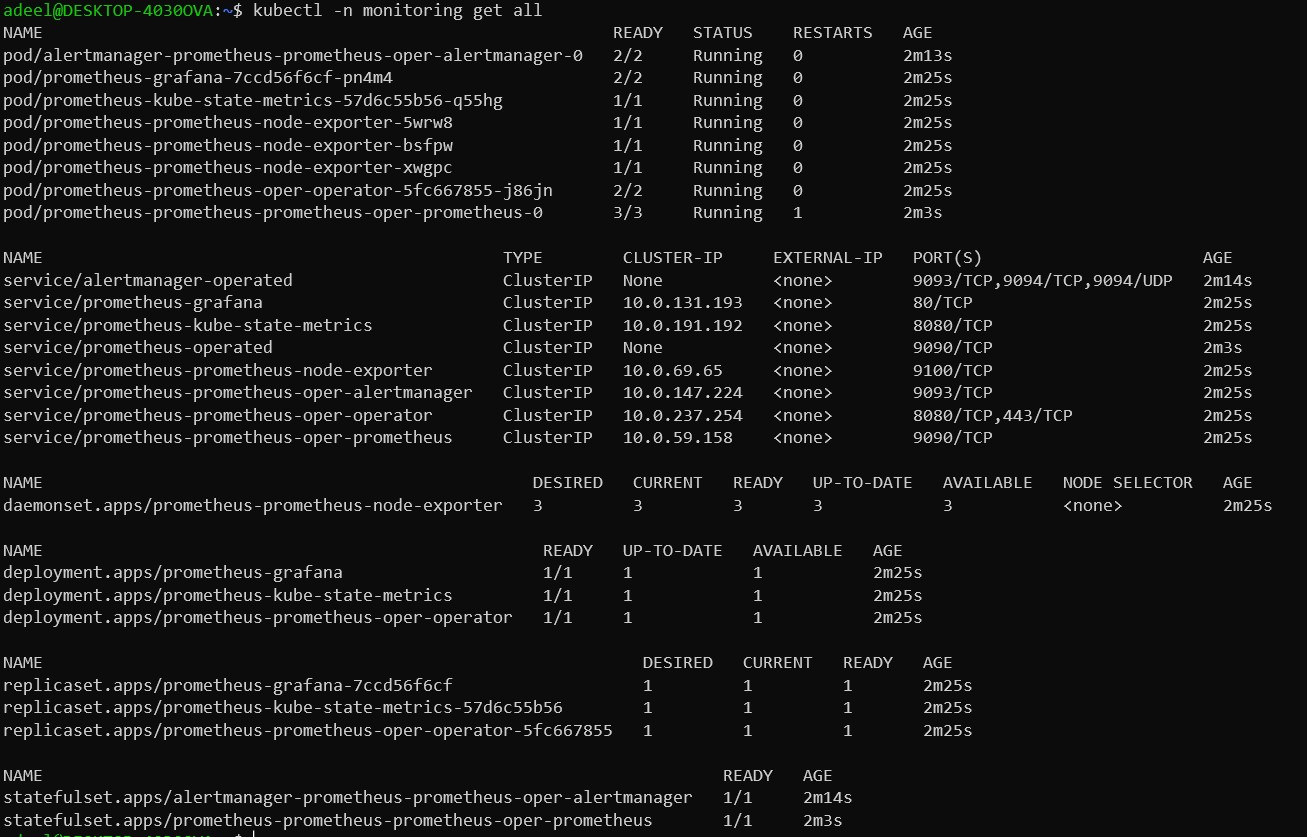
Let’s check the Prometheus page! First we execute Kubectl with port-forward
kubectl -n monitoring port-forward prometheus-prometheus-prometheus-oper-prometheus-0 9090
Then navigate to http://localhost:9090 and select Alerts
You will see a lot of Alerts in Red
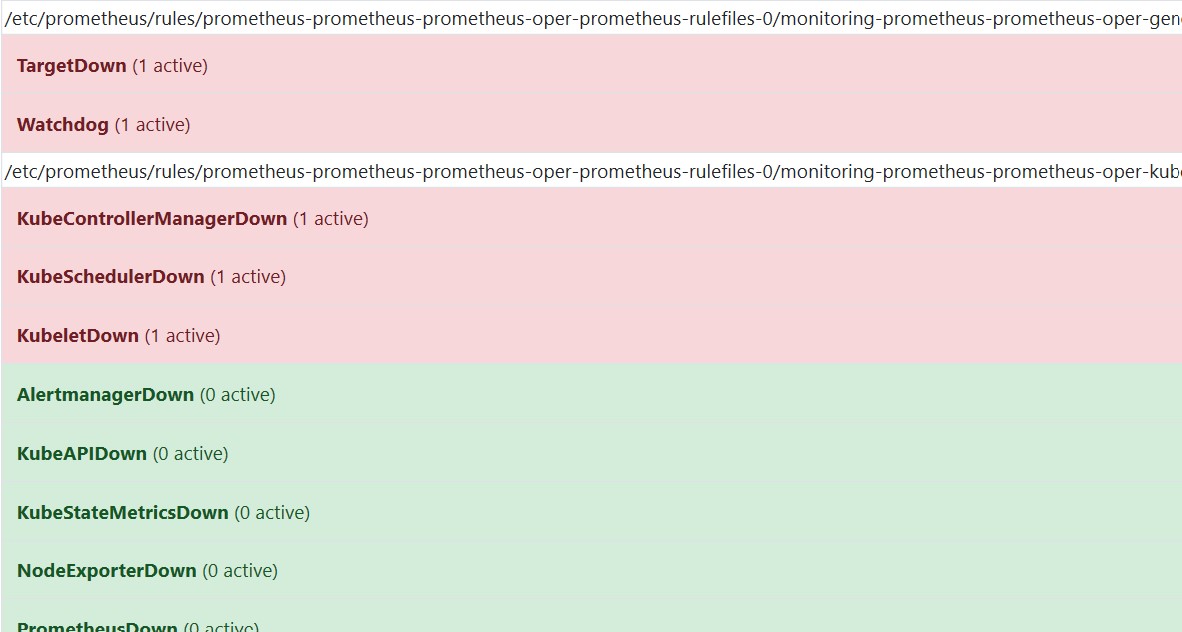
And selecting status > targets shows the targets reported as Down:
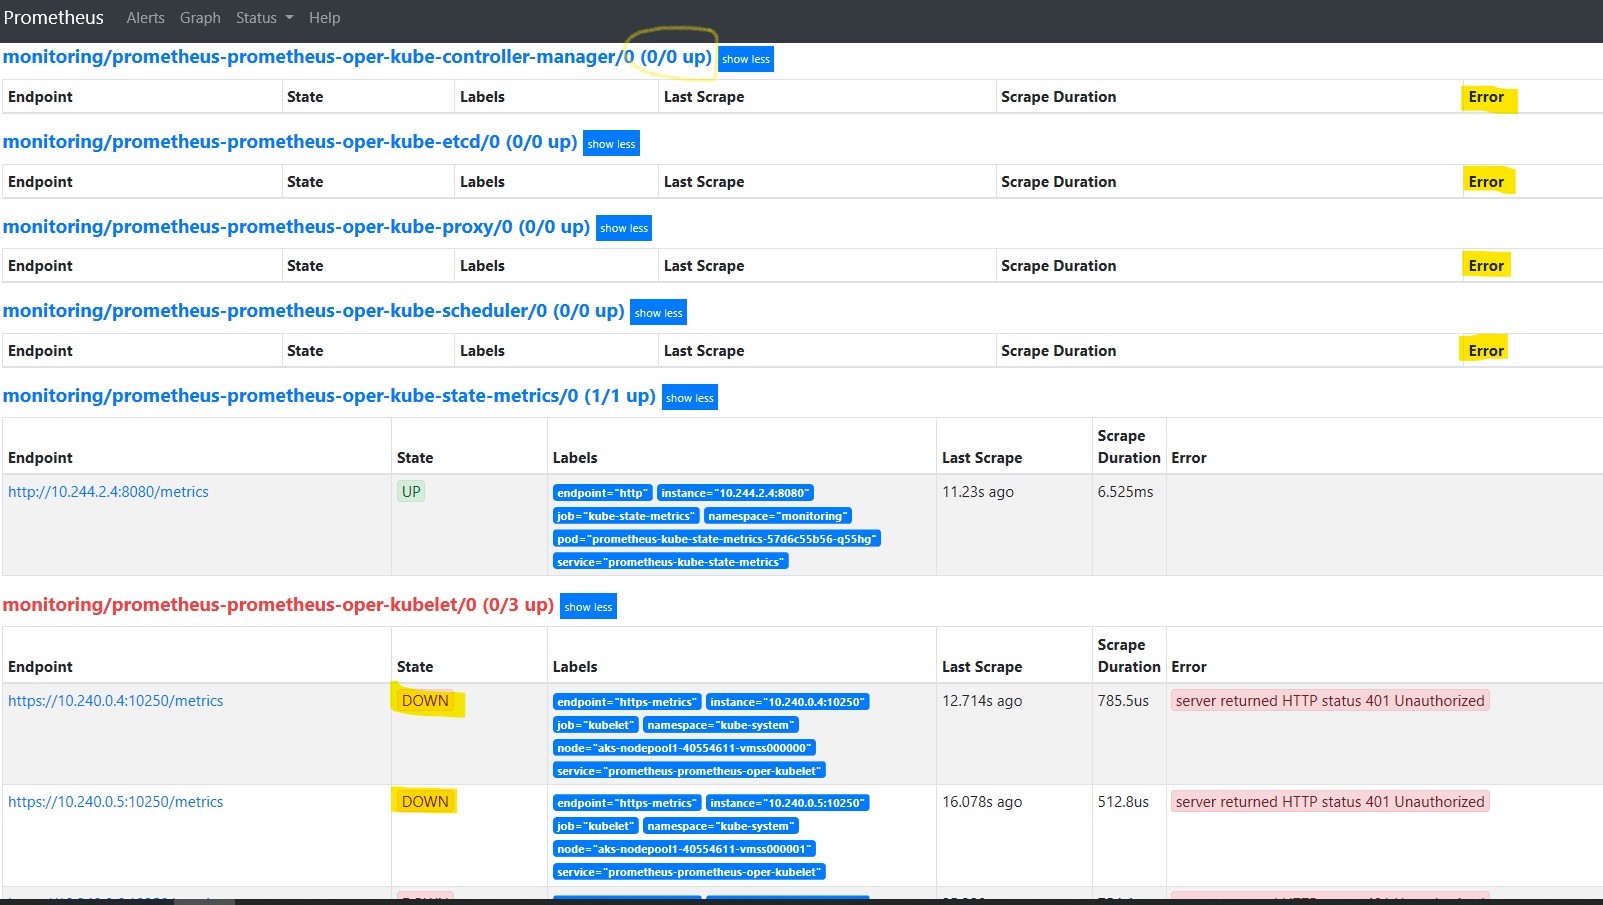
To correct these false positives and customize our Prometheus deployment to AKS, we will use valuse.yaml files to set the desired configuration for the Helm Chart
Values files
- helm/prometheus_values.yaml
---
# Forcing Kubelet metrics scraping on http
kubelet:
  enabled: true
  serviceMonitor:
    https: false
# Disabling scraping of Master Nodes Components
kubeControllerManager:
  enabled: false
kubeScheduler:
  enabled: false
kubeEtcd:
  enabled: false
kubeProxy:
  enabled: false
let’s uncomment the command and execute it as follows to update Helm with the new values:
helm upgrade --install prometheus \
--namespace monitoring \
stable/prometheus-operator \
--values ../helm/prometheus_values.yaml # \
# --values ../helm/alertmanager_values.yaml
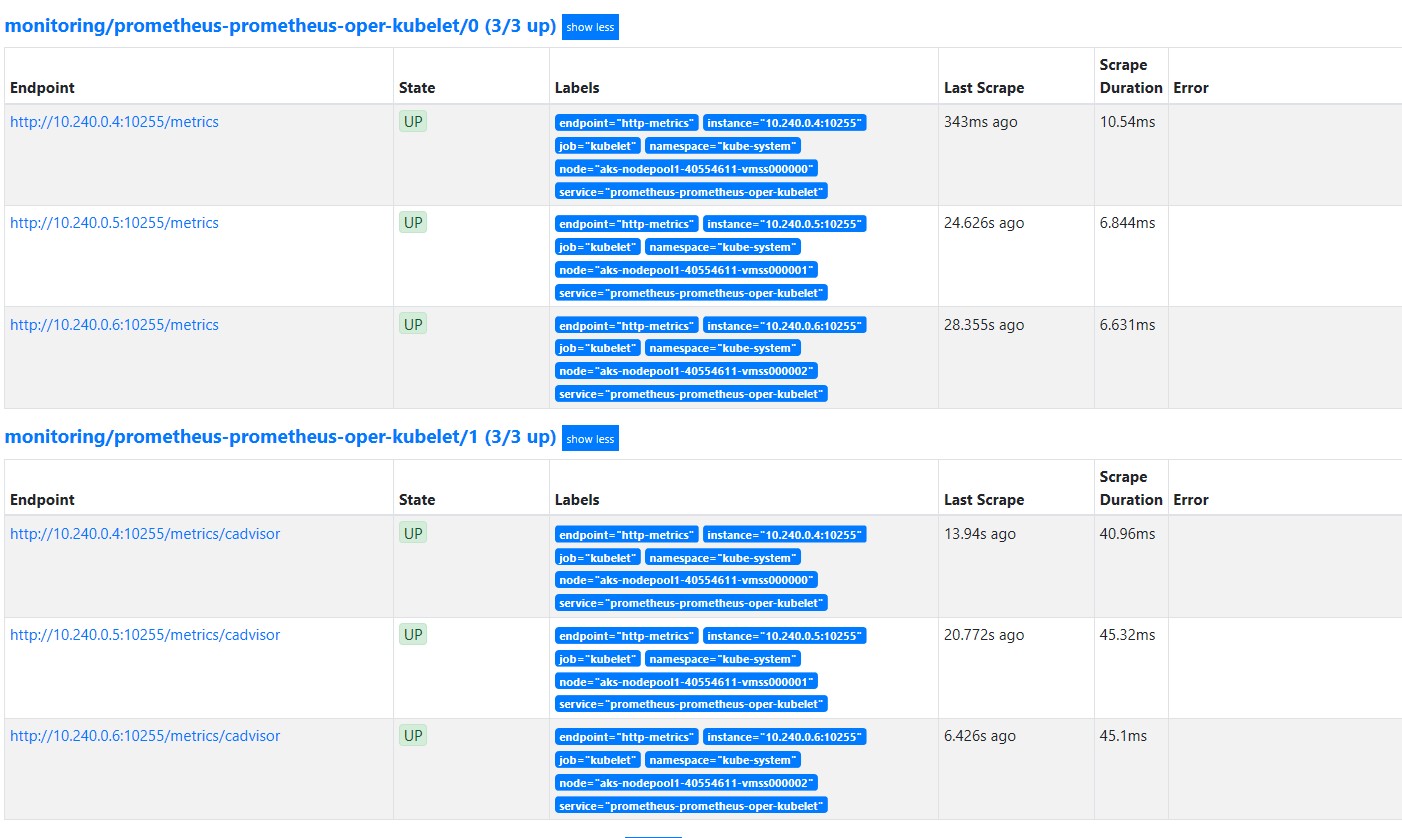
Here we go! all alerts are green except the watchdog alert -which is normal- and the kublet metrics are being scraped properly on http
watchdog This is an alert meant to ensure that the entire alerting pipeline is functional. This alert is always firing, therefore it should always be firing in Alertmanager and always fire against a receiver. There are integrations with various notification mechanisms that send a notification when this alert is not firing. For example the “DeadMansSnitch” integration in PagerDuty.
Configure alerts
The last task to perform on this section is to configure the Alerts and Receivers for Alertmanager
- helm/alertmanager_values.yaml
---
alertmanager:
  config:
    global:
      resolve_timeout: 5m
    route:
      group_by: ['job']
      group_wait: 30s
      group_interval: 5m
      repeat_interval: 12h
      receiver: 'null'
      routes:
      - match:
          alertname: Watchdog
        receiver: 'MySlackChannel'
      - match_re:
          severity: '^(none|warning|critical)$'
        receiver: 'null'
    receivers:
      - name: 'null'
      - name: 'MySlackChannel'
        slack_configs:
          - api_url: 'https://hooks.slack.com/services/000000000/00000000/00000000000000'
            channel: '#aks-prometheus'
in this example, a Receiver: MySlackChannel is configured to use a Slack Webhook in order to send alerts to a Slack Channel called #aks-prometheus.
      - name: 'MySlackChannel'
        slack_configs:
          - api_url: 'https://hooks.slack.com/services/000000000/00000000/00000000000000'
            channel: '#aks-prometheus'
And Watchdog Alerts are configured to be sent to that receiver - which is a good way to est that the alert process is working and that the webhook is working as well
      - match:
          alertname: Watchdog
        receiver: 'MySlackChannel'
let’s uncomment the command and execute it as follows to update Helm with the new values:
helm upgrade --install prometheus \
--namespace monitoring \
stable/prometheus-operator \
--values ../helm/prometheus_values.yaml \
--values ../helm/alertmanager_values.yaml
An alert is received on Slack for Watchdog
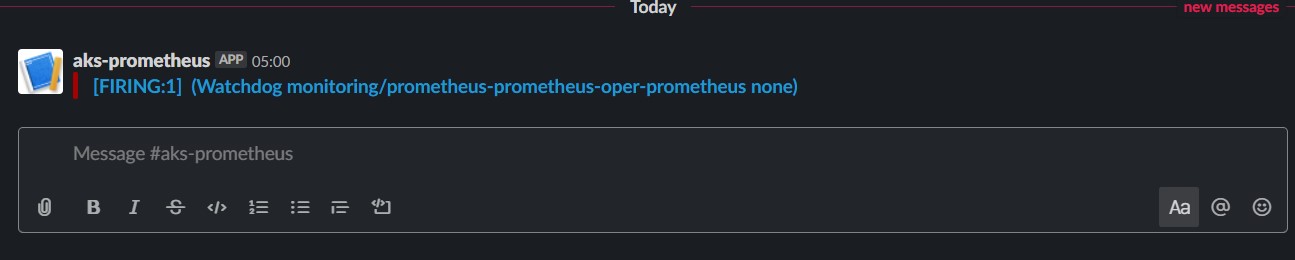
All looking good!
It’s time to disable Watchdog alerts from being sent. Simply, change the Alertmanager rule for this alert to null
      - match:
          alertname: Watchdog
        receiver: 'null'
And set the following to the live receiver
      - match_re:
          severity: '^(none|warning|critical)$'
        receiver: 'MySlackChannel'
Re-run the last command again to apply the new configuration:
helm upgrade --install prometheus \
--namespace monitoring \
stable/prometheus-operator \
--values ../helm/prometheus_values.yaml \
--values ../helm/alertmanager_values.yaml
Please refer to the Prometheus Operator values page for the Helm Chart at https://github.com/helm/charts/blob/master/stable/prometheus-operator/values.yaml
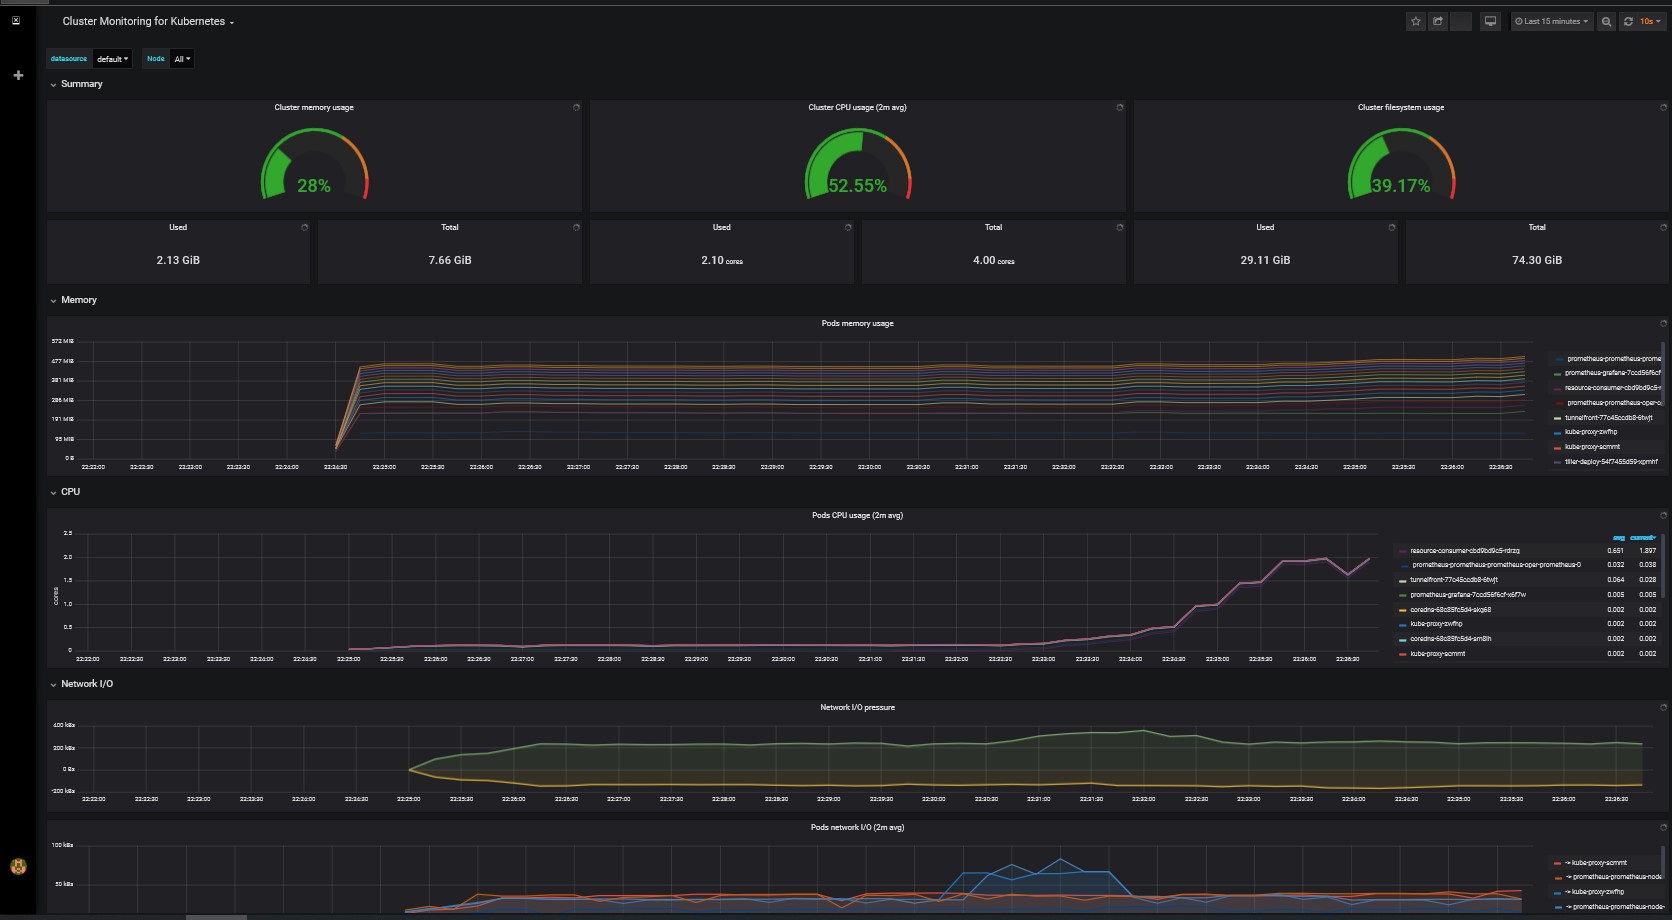
Grafana
Grafana Dashboard can be accessed by performing port-forward on the pod:
POD_NAME=$(kubectl get pods --namespace monitoring -l "app=grafana" -o jsonpath="{.items[0].metadata.name}")
kubectl --namespace monitoring port-forward $POD_NAME 3000
Then navigate to http://localhost:3000 to access Grafana Web Site - admin | password: prom-operator
ContainersAzurehelmdevopsaksdockerKubernetesPrometheusGrafanaAlertmanagerAzureMonitorAZCliAzureAdventCalendar
1303 Words
2019-12-06 00:00 +0000